Projects2024
LandSight
A landslide detection and forecasting model for India. XGBoost on terrain and seven days of rainfall, fed by GraphCast forecasts, at 93% accuracy on a laptop.
- Year
- 2024
- Duration
- 3 months
- Team
- Solo project
- Python
- XGBoost
- Google GraphCast
- Global Landslide Catalog
- EarthEnv topography
- NOAA NCEP reanalysis
TL;DR
LandSight is an ML model that detects and forecasts landslides in India. It is computationally inexpensive, runs on a standard laptop, and takes its weather from Google's GraphCast. I built it solo over three months. The final XGBoost model reaches 93% accuracy with a 0.92 F1 score, and with a 7-day GraphCast forecast it caught 24 of 27 real landslides from 2020.
Why I built it
Landslides are among the deadliest natural disasters, causing about 4,600 fatalities globally each year and over $4 billion in damages. India ranks among the top five countries most affected, with 12.6% of its land area prone to landslides, especially in the Himalayas, the Western Ghats, and the Northeastern states. Between 2004 and 2016, over 4,000 people died from landslides in India, with economic losses amounting to $400 million annually.
They also devastate farmers by destroying fertile land, crops, and irrigation systems. Nepal loses 12,000 hectares of farmland to landslides every year, and a single landslide in Himachal Pradesh displaced 300 farmers.
Today's models fall short on latency, scalability and accuracy. Prediction models such as NASA's LHASA have high computational costs and slow refresh rates, often only once a day, despite the availability of hourly satellite and radar data. Their accessibility is restricted to centralized modeling centers such as those in the USA and Europe. And many do not use the latest AI-driven weather forecasting, which can fold in real-time weather and landscape data and be computationally cheap.
How it works
LandSight follows a four-stage architecture: feature engineering, model selection, synthetic data generation, and integration with GraphCast.
1. Choosing the features
I started with a literature review to identify the parameters that influence landslide probability. To assess slope stability I considered the factor of safety (FOS) and Landslide Hazard Index (LHI) equations, which bring in topographic, geological, and rainfall-related parameters. Precipitation, slope, and elevation came out as the core features.
Each sample is a location and a date, described by nine numbers:
| Feature | What it is |
|---|---|
precip_lag0 | Precipitation on the day of the landslide |
precip_lag1 to precip_lag6 | Precipitation one to six days before |
Elevation | Elevation at that latitude and longitude |
Slope | Slope at that latitude and longitude |
2. Building the dataset
Landslide occurrences from 2007 to 2016 came from the public Global Landslide Catalog (GLC), cleaned down to landslides in India with a date, latitude, and longitude: approximately 1,265 events. For each one I pulled daily precipitation for the event date and the preceding week from NOAA's NCEP reanalysis, and elevation and slope from EarthEnv's topographic variables. Cleaned and joined, these became a single dataset with the necessary parameters, which hadn't existed in one place before.
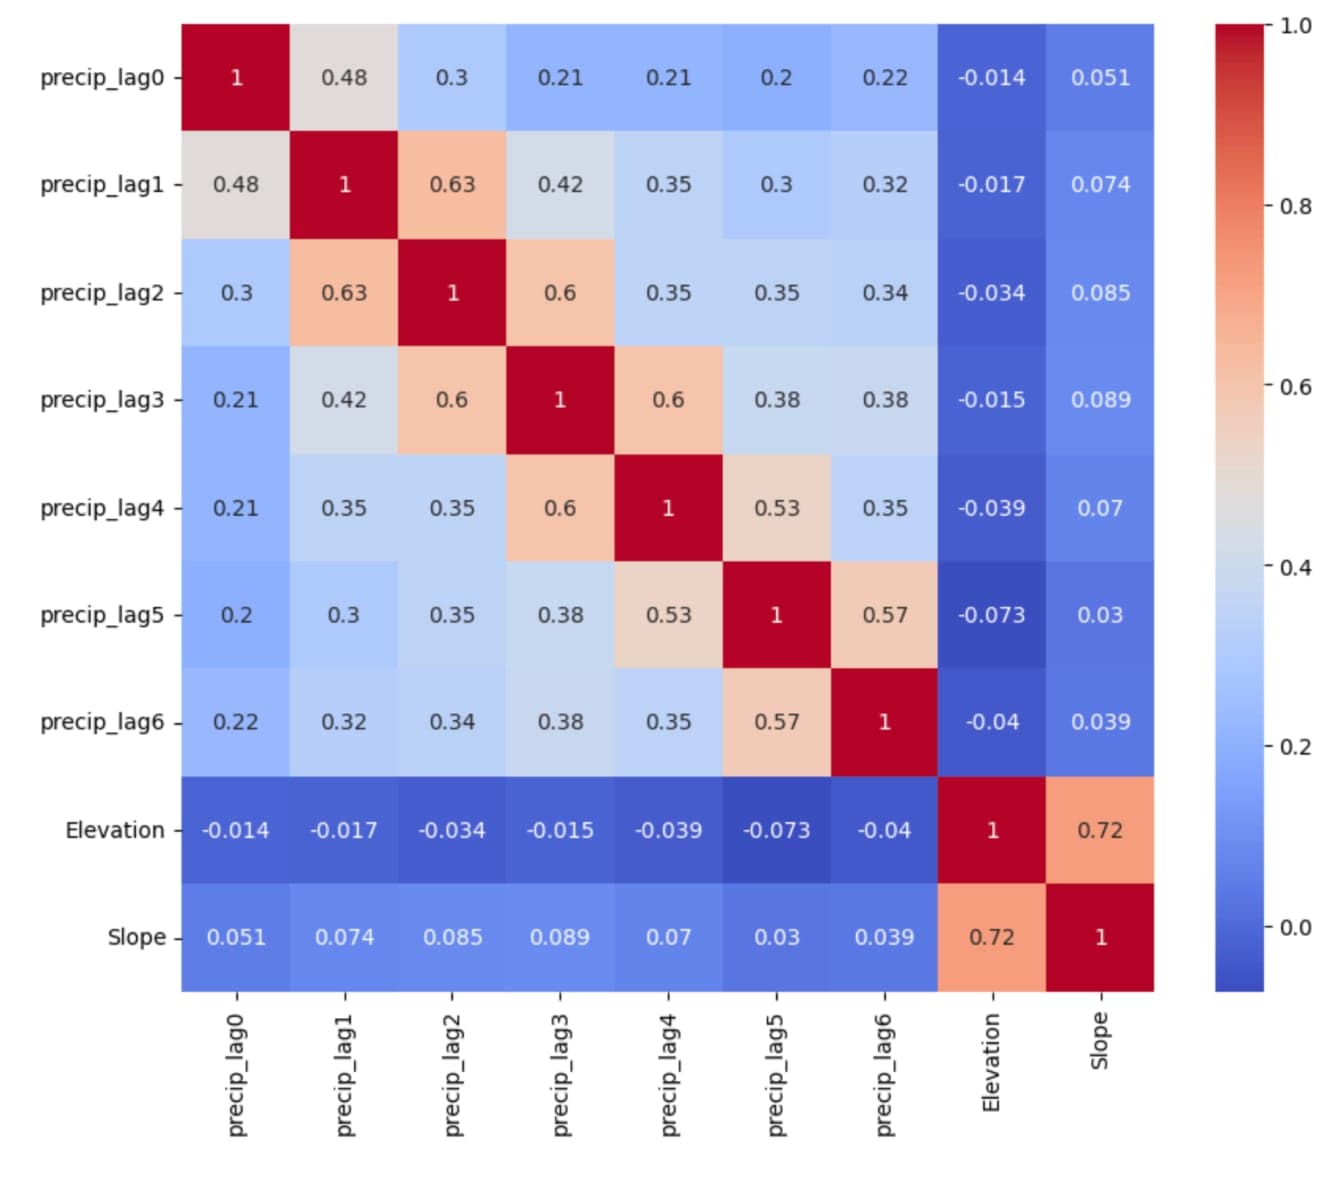
The heatmap shows two things. Precipitation at different lags is moderately to strongly correlated, most of all between adjacent days (0.48 to 0.63), which is common in time-series data. Slope and elevation are correlated with each other (0.72) but have almost no relationship with the precipitation lags, so the terrain features are largely independent of recent rainfall in this dataset.
3. Synthetic non-landslide events
A catalog of landslides only contains positives. To overcome data scarcity and prevent overfitting, I generated synthetic data for 1,400 non-landslide event conditions, bringing the dataset to 2,665 instances. This let the model adapt to diverse terrains and environmental conditions and generalize instead of memorizing.
4. Selecting the model
I tested nine models on an 80:20 training-to-testing split, scoring each on predictive performance and computational cost, since the final model had to be both reliable and accessible in low-resource settings.
| Model | Accuracy | F1 score | 2020 landslides caught | POD |
|---|---|---|---|---|
| XGBoost | 93% | 0.92 | 24/27 | 88.89% |
| Random Forest | 90% | 0.89 | 18/27 | 66.67% |
| Logistic Regression | 85% | 0.84 | 23/27 | 85.19% |
| KNN | 85% | 0.84 | 21/27 | 77.78% |
| SVC | 84% | 0.82 | 23/27 | 85.19% |
| ANN | 83% | 0.82 | 21/27 | 77.78% |
| BPNN | 86% | 0.84 | ||
| Deep Learning | 84% | 0.83 | ||
| LSTM | 73% | 0.71 |
Accuracy and F1 score were measured on the landslide and non-landslide instances from 2007 to 2016. Probability of Detection (POD) was measured separately, on 27 landslides from 2020. XGBoost won on both.
As a sample of what sits behind a row in that table, this is the confusion matrix from a Random Forest run on 553 held-out cases:
| Predicted no landslide | Predicted landslide | |
|---|---|---|
| No landslide (291) | 261 | 30 |
| Landslide (262) | 29 | 233 |
That run scored 0.88 to 0.89 on precision, recall and F1 for both classes.
5. What the model learned
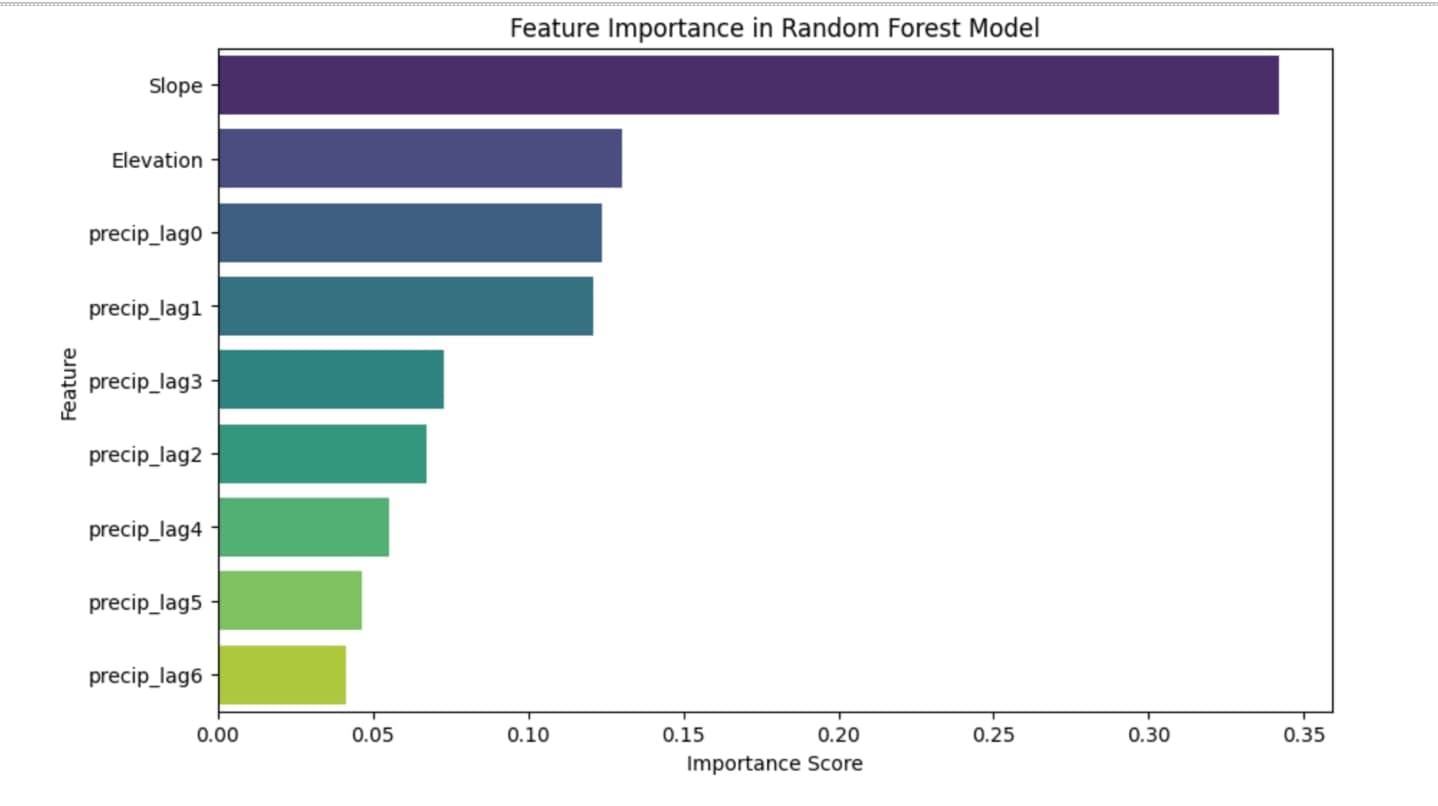
Most of the models gave the highest importance to topography, followed by precipitation. Slope was the most significant factor by a wide margin, with a feature importance score of about 0.34 on a 0 to 1 scale. Elevation and the precipitation on the day of the landslide came next, at roughly 0.13 to 0.15 each, then the precipitation of the day before. Rain from five or six days earlier mattered least.
6. Forecasting with GraphCast
The final stage connects the model to Google DeepMind's GraphCast, an AI weather model that forecasts precipitation quickly and at high accuracy. GraphCast supplies a 7-day precipitation forecast, which is combined with the static elevation and slope data and passed to the model. Because GraphCast updates every six hours and the landslide model is small, a prediction can be generated within one minute.
To test it, I ran the integrated model on 27 landslide occurrences from 2020. XGBoost correctly predicted 24 of them, an 88.89% probability of detection.
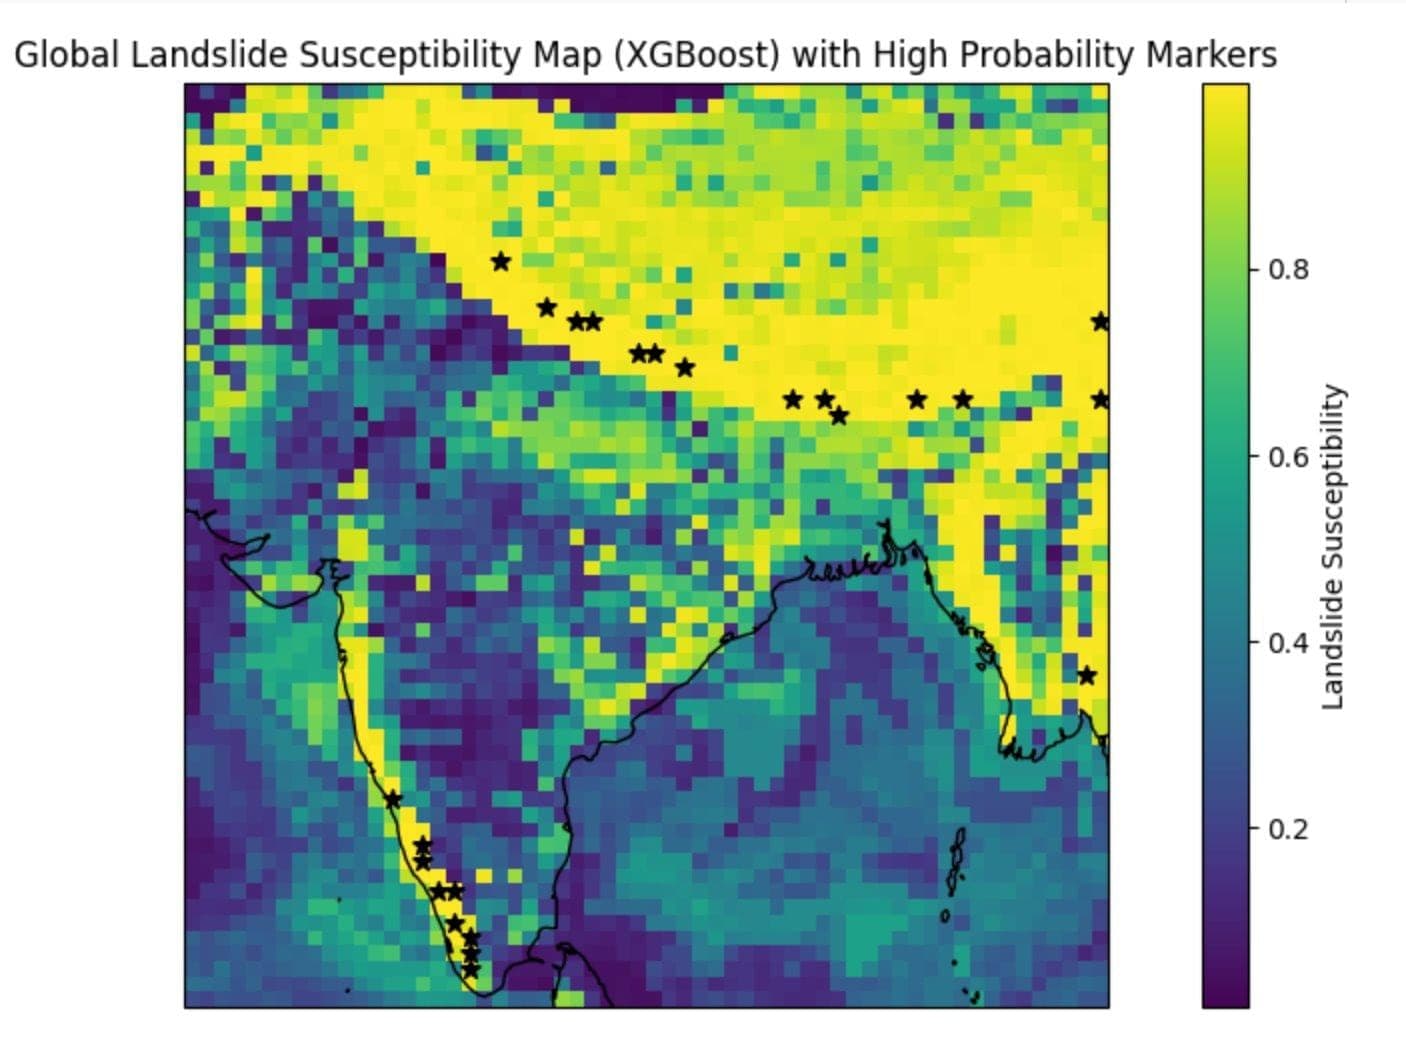
The same pipeline produces a terrain susceptibility map.
I chose 6 August 2020 to cross-verify against ground truth. Three landslides were reported in India that day: in Nilgiris District, Tamil Nadu; Pettimudi, Kerala; and Talacauvery, Karnataka. All three lie along the Western Ghats, where the map places its southern cluster of high-risk markers.
Key decisions
XGBoost
It had the highest accuracy (93%), the highest F1 score (0.92) and the highest probability of detection on the 2020 landslides (24 of 27), at low computational cost. Random Forest came close on accuracy but caught only 18 of the 27.
instead ofRandom Forest, logistic regression, KNN, SVC, and four neural approaches (ANN, BPNN, deep learning, LSTM)
An AI weather model for the forecast
GraphCast gives precise precipitation forecasts with rapid updates, and precipitation is the input that changes. Pairing it with pre-trained models and static terrain data is what lets LandSight run on a standard laptop.
instead ofComputationally expensive numerical methods on centralized supercomputers
Focus on high-risk regions
Limiting the scope keeps the data pipeline light, which keeps the cost down and the refresh fast.
instead ofProcessing high-resolution global data, as LHASA does
Synthetic non-landslide events
Landslide data is scarce and one-sided. Generating 1,400 non-landslide conditions prevented overfitting and helped the model generalize across terrain.
Sources
- Landslides: NASA Global Landslide Catalog; Geological Survey of India landslide incidents, 2020.
- Precipitation: NOAA NCEP Reanalysis 2, daily.
- Elevation and slope: Amatulli et al., "A Suite of Global, Cross-Scale Topographic Variables for Environmental and Biodiversity Modeling", EarthEnv, 2018.
- Weather model: Lam et al., "GraphCast: Learning skillful medium-range global weather forecasting", arXiv:2212.12794, 2022.